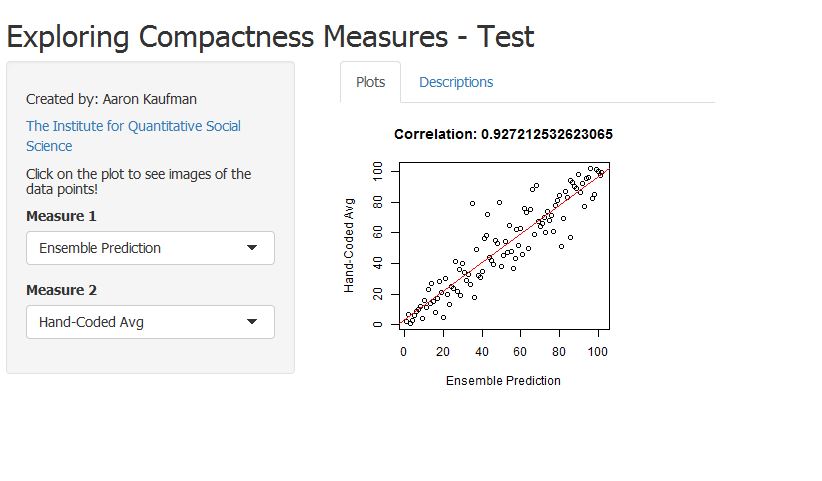
This R Shiny application provides a highly flexible framework for exploring residual values to understand predictive heterogeneity. Two drop-down menus allow the user to select variables to compare. The application draws the 45-degree line, and plots points. Clicking on the plot pulls up a description of that observation.